
In-depth articles and video walkthroughs on building, testing, and managing algorithmic breakout strategies with BreakoutOS.






No posts or videos matched
Try a different keyword - topics include filters, indicators, strategies, NASDAQ, gold, crypto, and more.
October 2, 2026
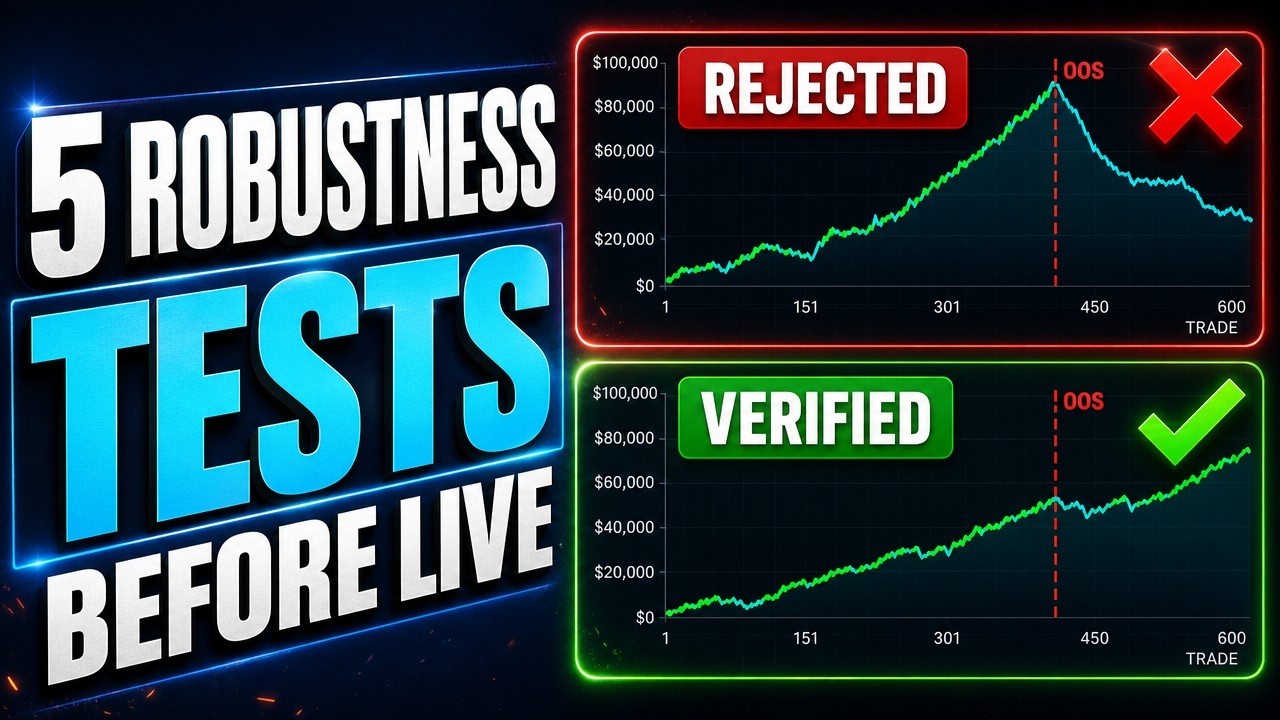
One breakout strategy, five robustness tests, one score. It scored 74 overall with 80 on space robustness, 71 on neighbor sensitivity and 100 on recency, and still got rejected: walk-forward came in at 54, and the standalone in-sample and out-of-sample scores were 56 and 58.
Read more →September 24, 2026
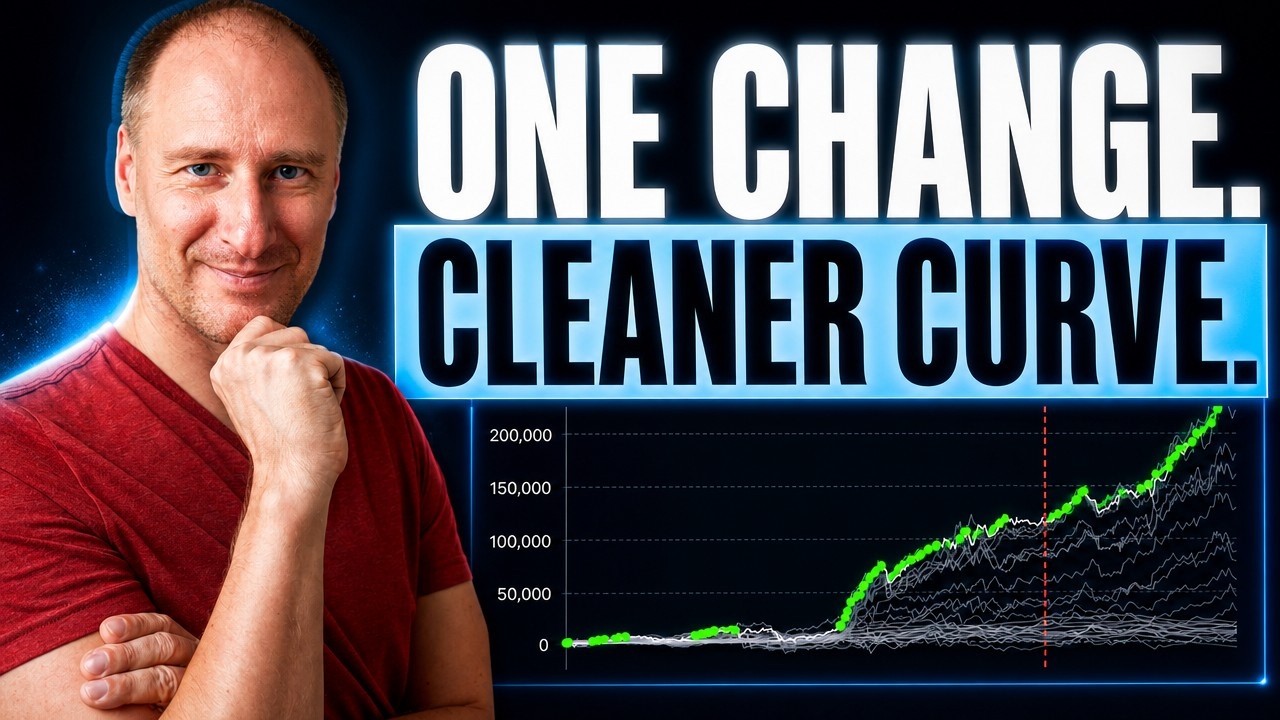
Same NASDAQ breakout model, one change: the Robustness Suite score jumped from 44 to 76 after limiting entries to a 4 a.m.-8 p.m. Monday window that Market Mapper scored 100. Before the change, the first usable strategy out of 2,000 prototypes sat at number 7.
Read more →September 17, 2026
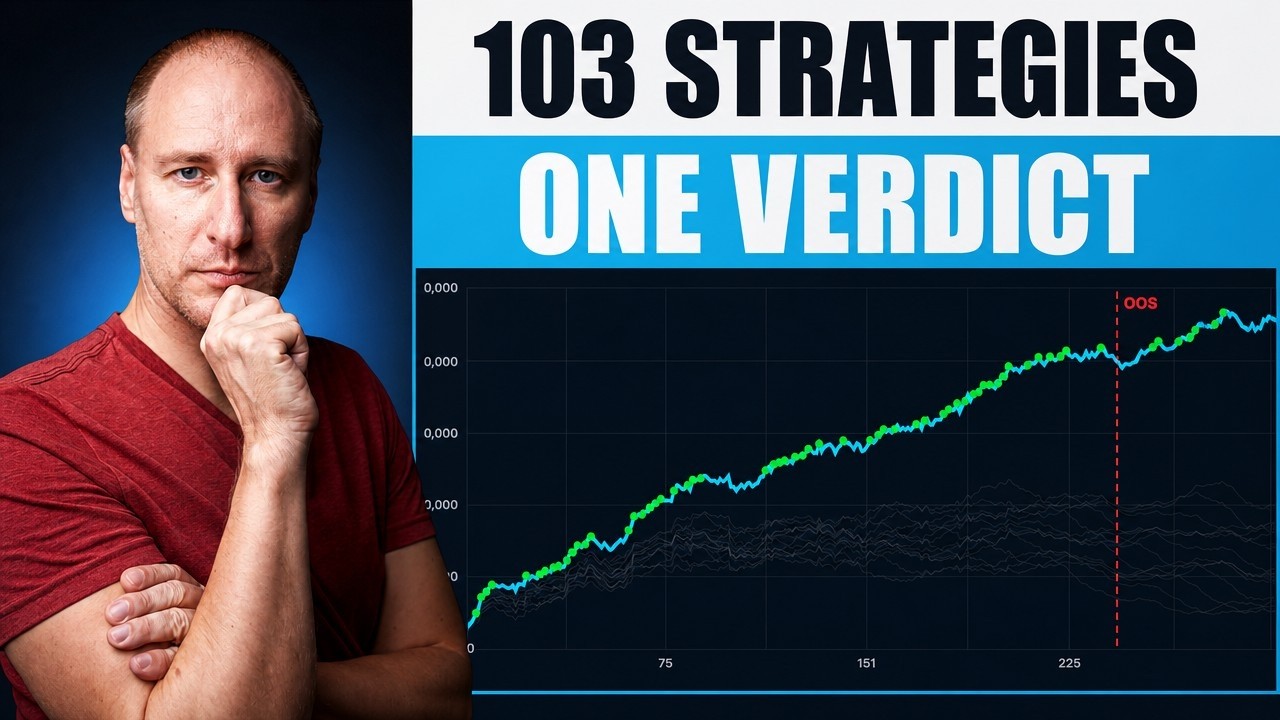
We scored 103 breakout strategies across 8 markets using in-sample data only, then tested them on data the score had never seen. 68% of strategies scoring 65 or higher stayed positive out-of-sample, against 48% below the threshold. Above 80, the pass rate climbed to 76.2%.
Read more →September 11, 2026
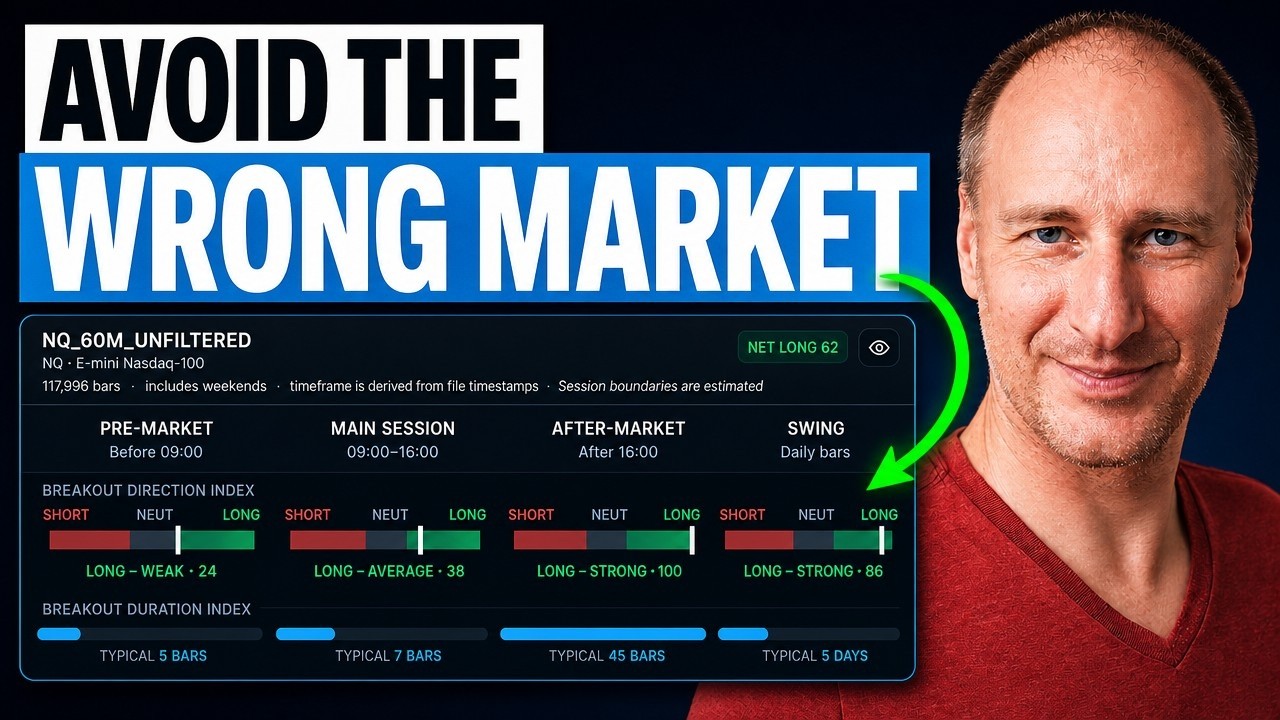
Five markets scored in a single pass: E-mini NASDAQ came back strong for aftermarket and long-side swing breakouts, E-mini Dow scored 58 points in the premarket, gold was swing-only, and EUR/GBP failed outright. The same scan returns breakout duration, up to 45 bars on NASDAQ, which is 45 hours of hourly data.
Read more →September 3, 2026
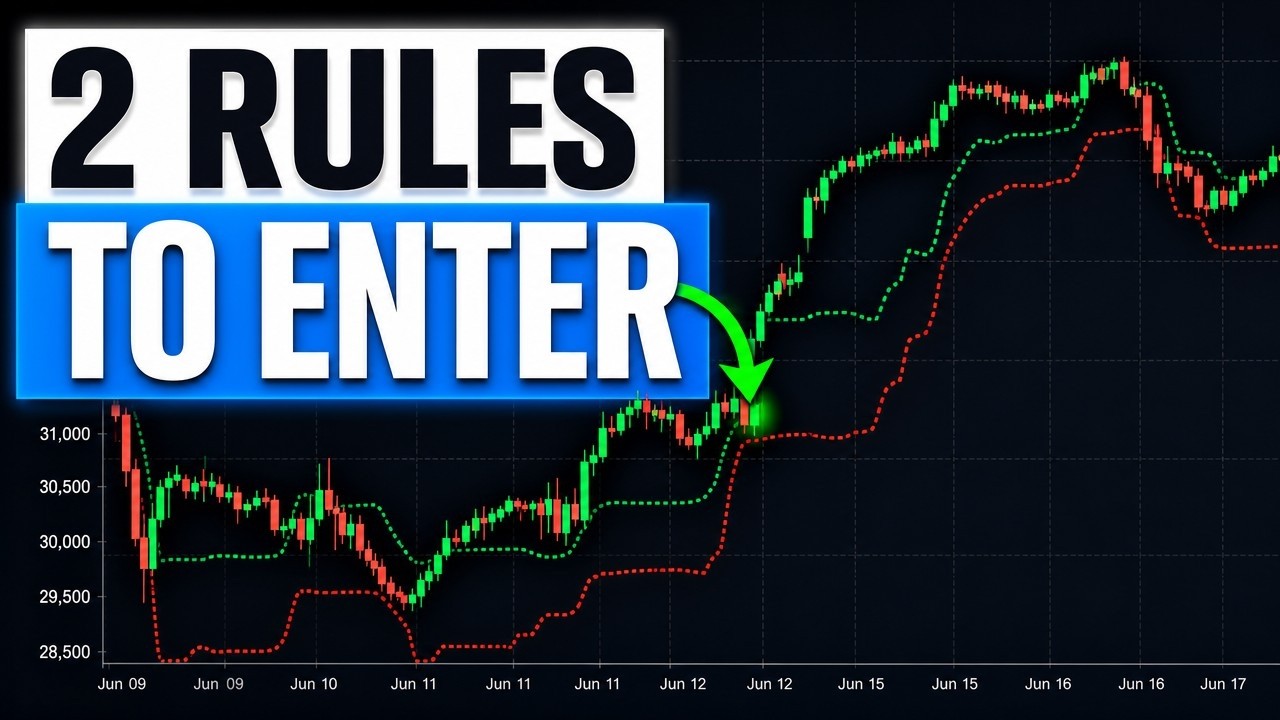
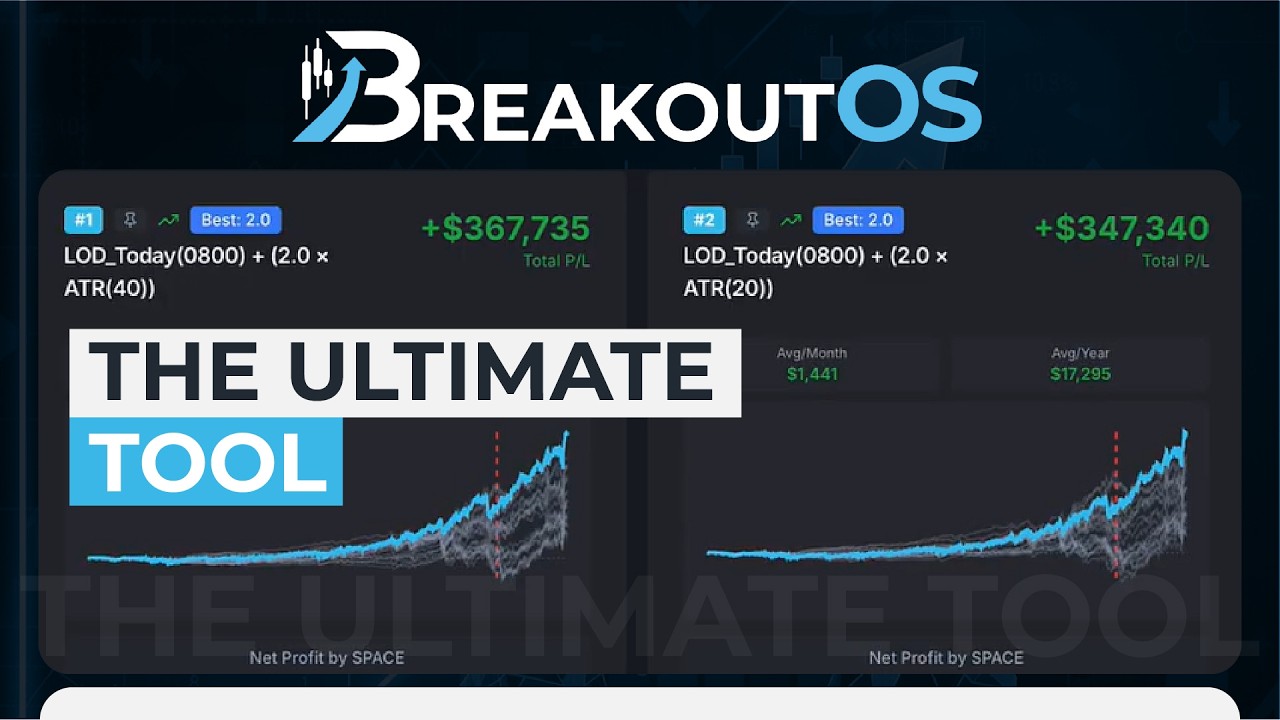
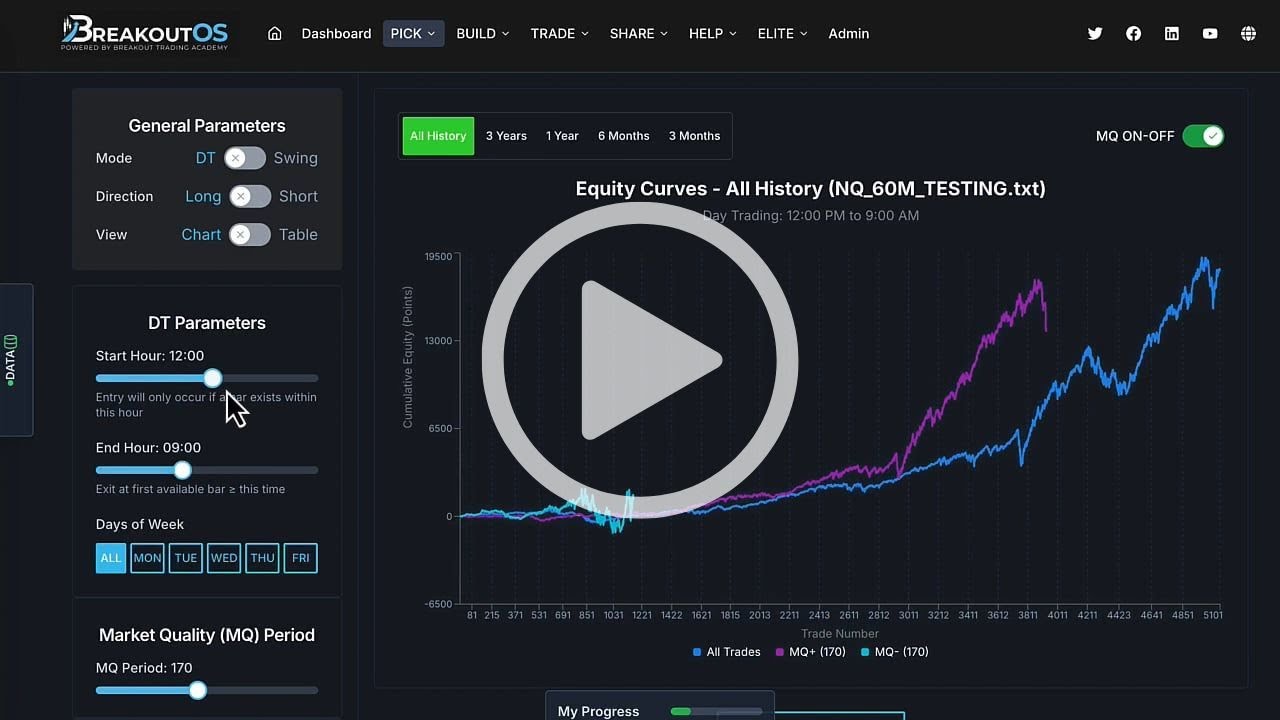
A breakout entry is two measurable parts: a point of initiation and an ATR volatility band. On E-mini NASDAQ one-hour data, a single day-trading preset expands into 600 iterations - 8 anchors, 3 band types, 25 multipliers - and the winning combination (pivot reset at 6am, ATR period 5, 1.0 multiplier) scored 68% robustness.
Read more →July 15, 2026
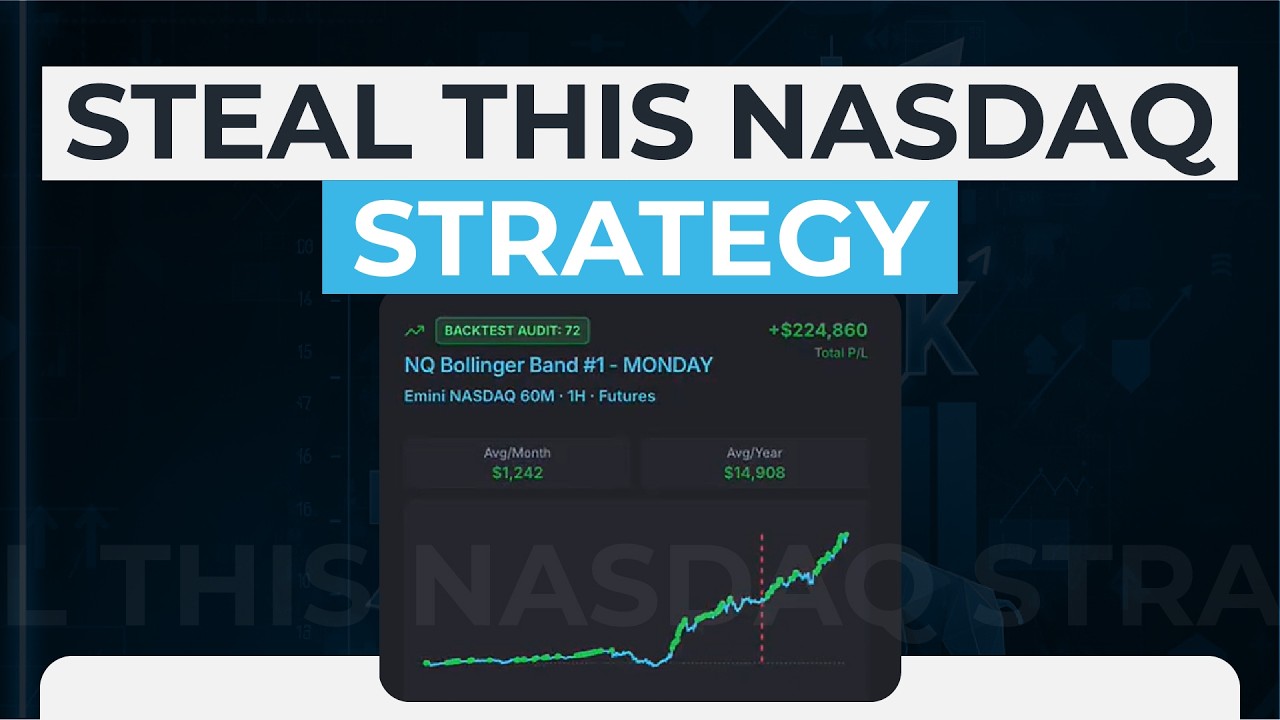
The BreakoutOS Backtest Auditor benchmarks your strategy against 1,000 structurally similar strategies to catch overfitting walk-forward misses. A Bollinger Bands Monday strategy scored 97 on the edge test (beating 98% of peers), held 91% of its edge under 1-3 bar shifts, and posted just 1% correlation to the market - an overall ~70% and a clear live-ready verdict.
Read more →July 12, 2026
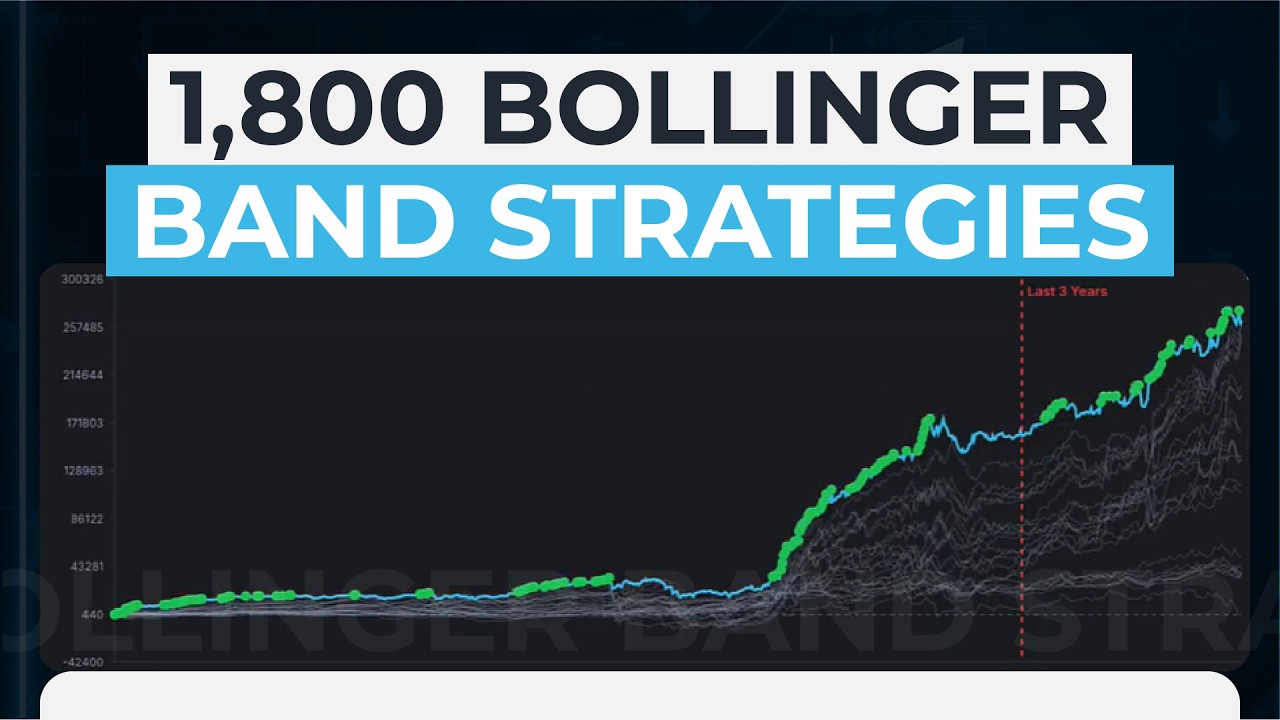
1,800 Bollinger Bands breakout strategies built on E-mini NASDAQ in minutes, then filtered down to one Monday day-trading strategy: 1.8 ATR space, walk-forward rank #1, an 86% robustness index, and a protective stop triggered just 4.2% of the time. Cross-validated on E-mini Dow, S&P, and Russell 2000.
Read more →June 21, 2026
276 time strategy combinations mapped across ~20 years of E-mini NASDAQ 60-minute data in one click. Monday and Tuesday 10am-10pm emerged as the strongest long edge, while Thursday flipped short. Plus the robustness trap: an 8am-8pm window scored a perfect 100 but was untradable.
Read more →June 11, 2026
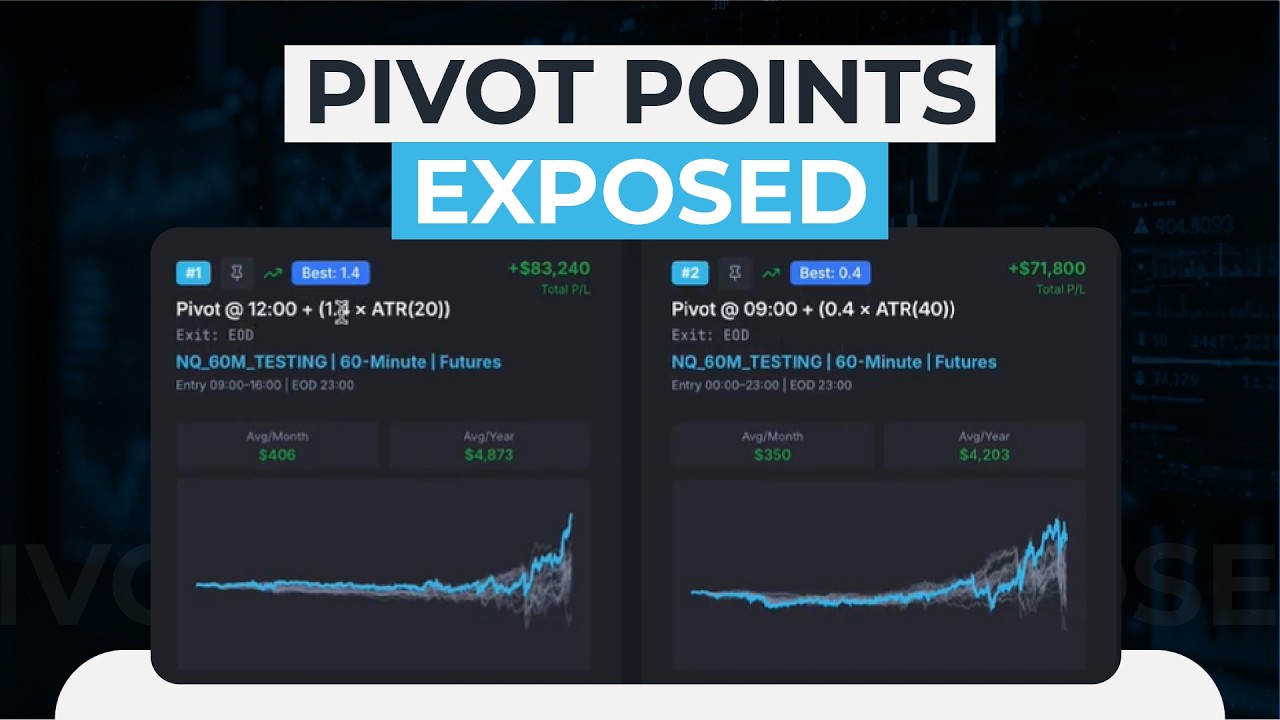
288 pivot point strategies tested on E-mini NASDAQ across 8 session boundary times and ~10,500 iterations. Midnight won on raw results, but the midday pivot won on robustness with nearly 90% of its space profitable - ATR 20, multiplier 1.4, ranked #1 in walk-forward analysis.
Read more →May 14, 2026
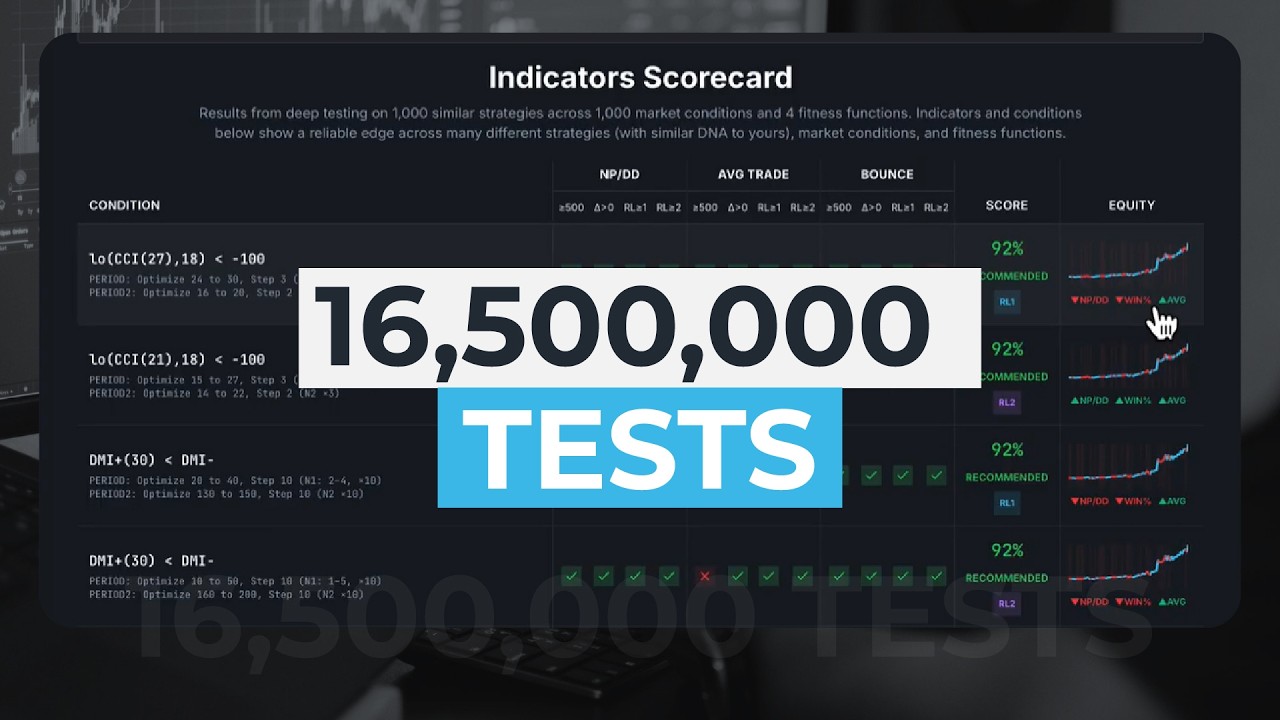
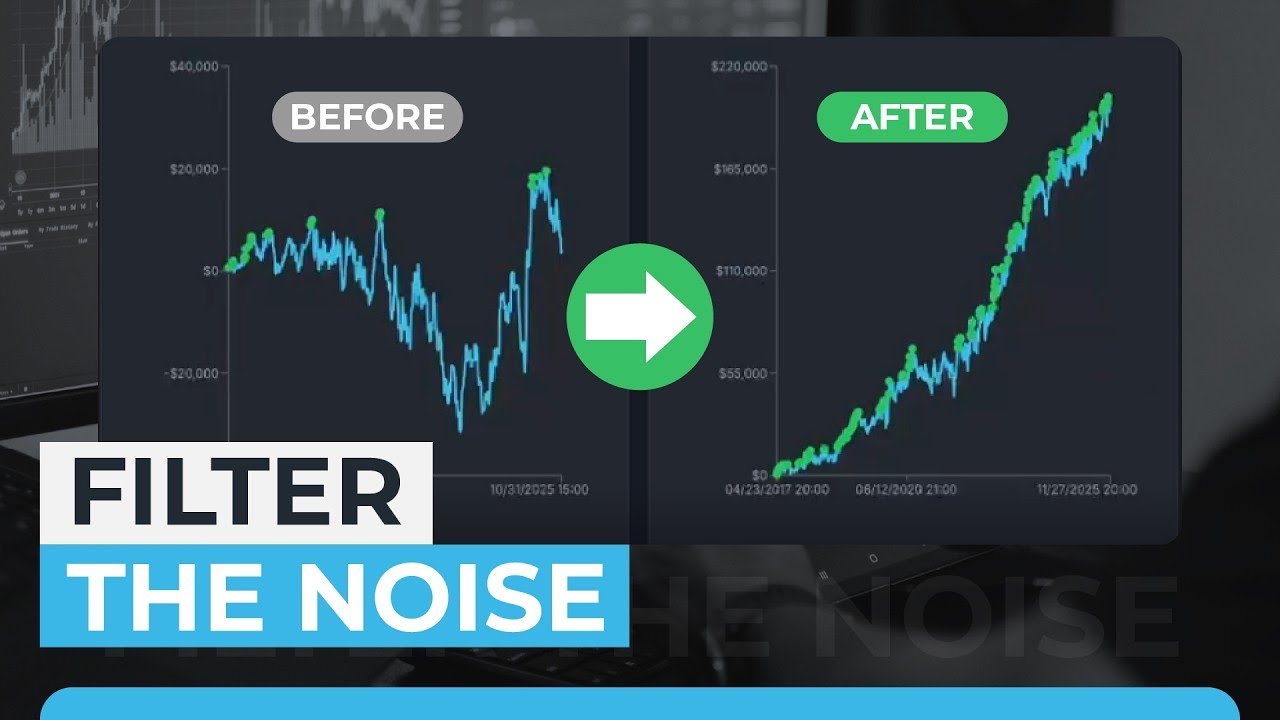
16.5 million filter tests across 1,000 NASDAQ strategies revealed a CCI-based correction filter that improved net profit on 69% of strategies and rescued 57.8% of losing variations. Here is the exact condition and why it survives unseen markets.
Read more →April 24, 2026
One condition - is the entry bar high above today's open? - cuts drawdown by 37% and improves profit-to-drawdown ratio by 53% on E-mini NASDAQ. Zero parameters, zero overfitting risk.
Read more →April 16, 2026
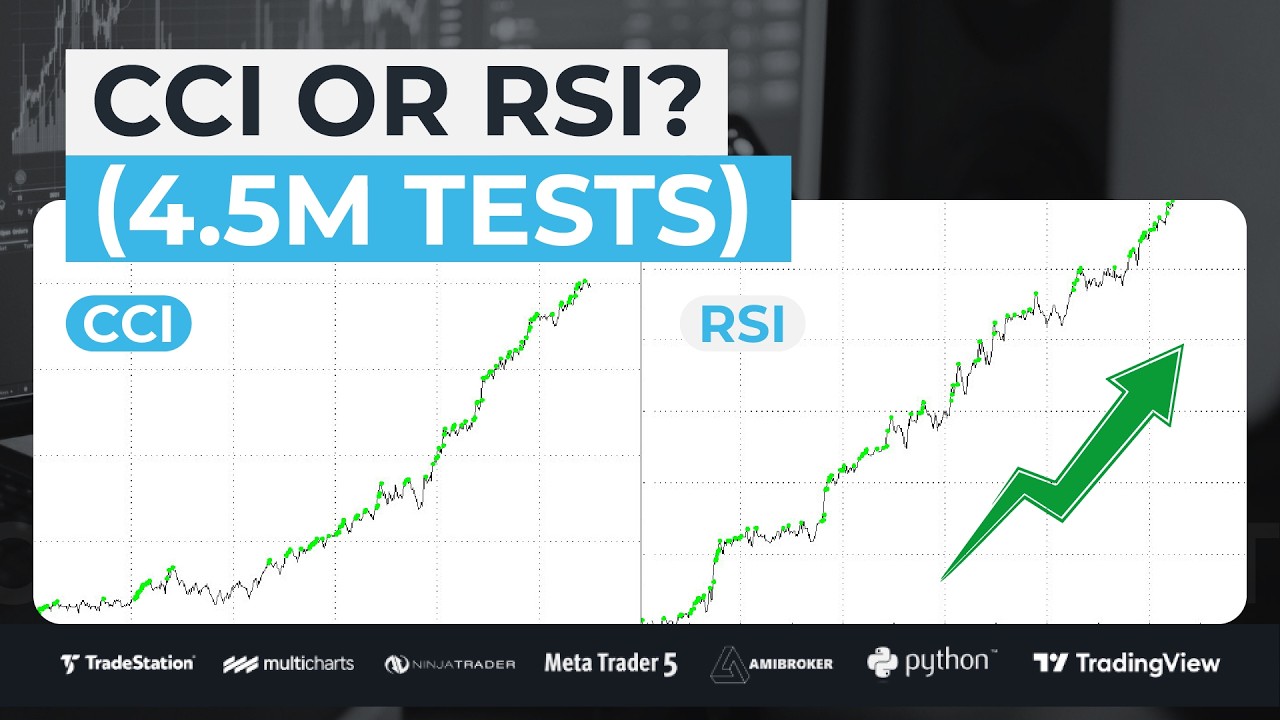
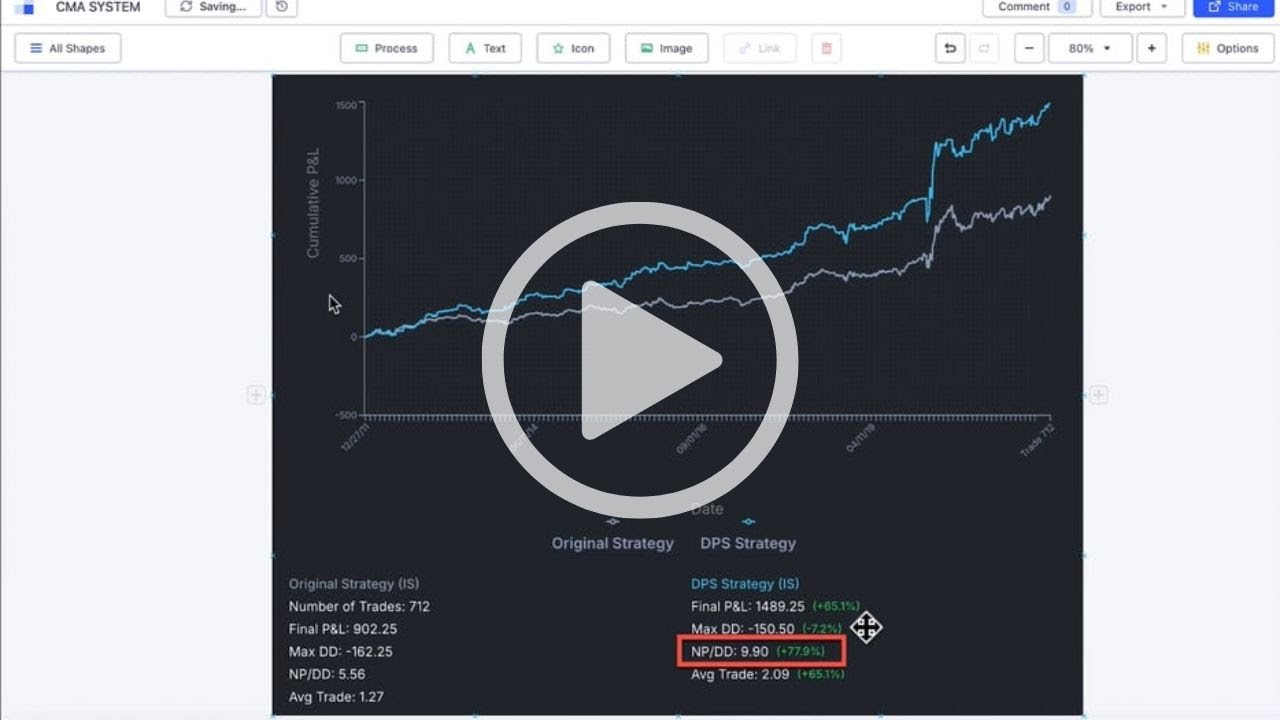
CCI improved average trade by 65% and recovered 60% of losing strategies across 4,500,000 iterations on e-mini NASDAQ. RSI's best result was 50% - barely "viable." Here is what the data shows.
Read more →April 14, 2026
SMA vs EMA tested across 1,000 strategies and 1,000 market conditions in BreakoutOS. Simple moving average improved average trade by 48% across any period. The dual EMA crossover was the top performer overall.
Read more →April 5, 2026
I tested AI across 7 real case studies: 100 AI-generated indicators, a strategy rescued with an AI filter, an ADX improved from $87K to $200K+. Here is what the data shows.
Read more →March 31, 2026
Five zero-parameter and low-parameter filtering techniques tested across NASDAQ, S&P 500, Dow, and Nikkei futures. The best technique reduced drawdowns by 79% and improved profit-to-drawdown ratio from 5 to 20.
Read more →March 27, 2026
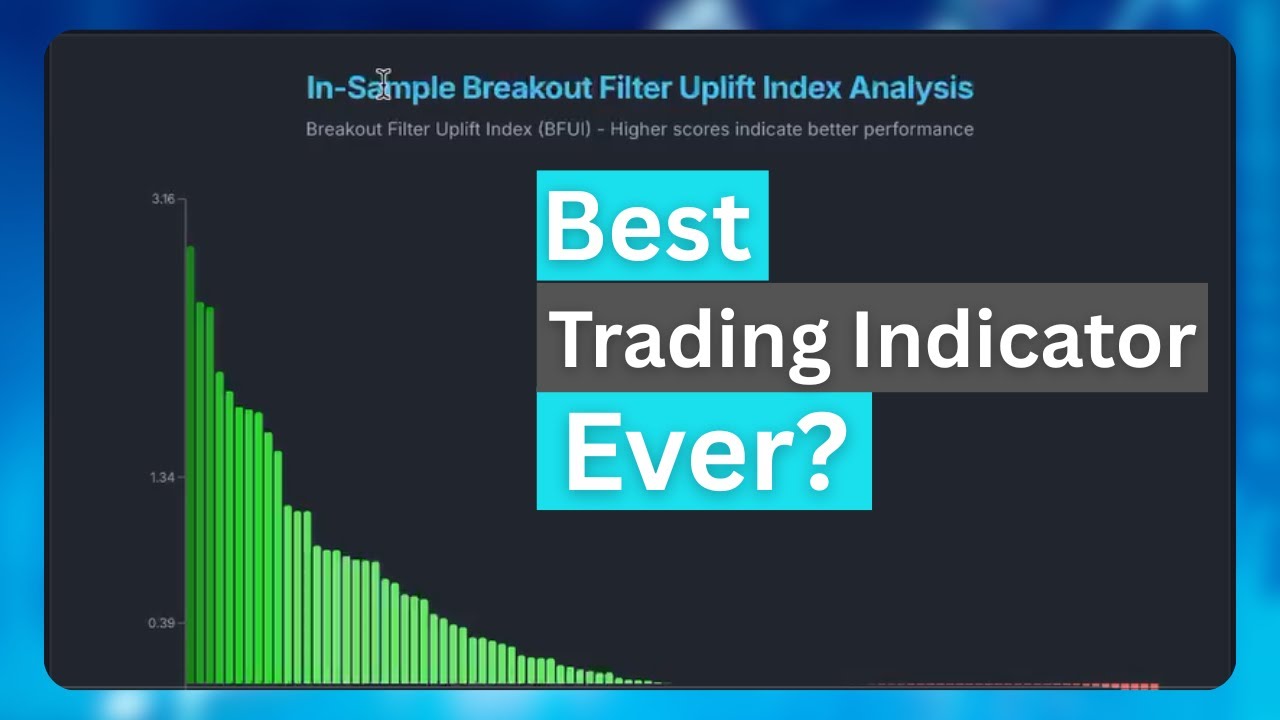
Volatility-based indicators ranked first across both NASDAQ and Bitcoin. Oscillators ranked last. A study of 100 indicators tested on 4,100+ breakout strategies reveals which filters actually improve performance.
Read more →March 24, 2026
Win percentage has only 11% correlation between backtest and live results. Net profit has 63%. A 2,500-strategy study reveals which fitness function actually predicts forward performance.
Read more →March 20, 2026
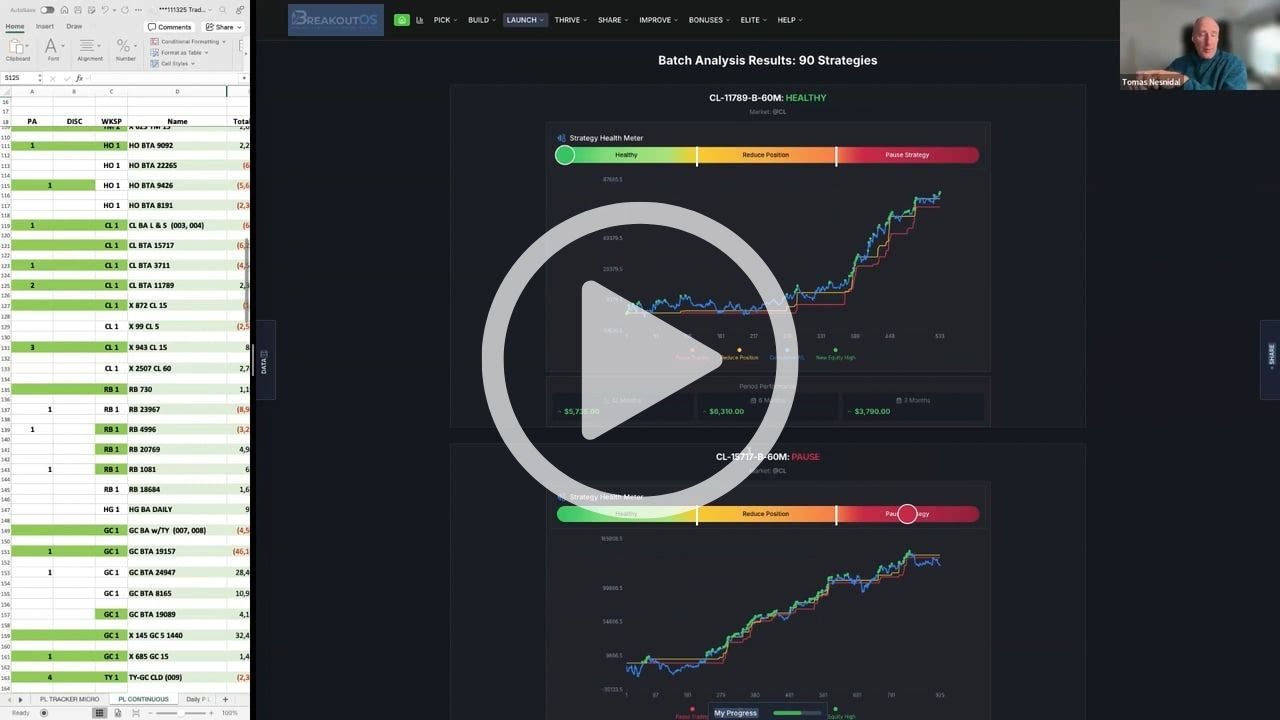
A BreakoutOS member running 90 strategies achieves 10% monthly profits using the Strategy Health Monitor's traffic-light system to rotate strategies weekly.
Read more →March 10, 2026
BreakoutOS members build and monitor breakout strategies with the Strategy Health Monitor. See real leaderboard results and portfolio-level performance.
Read more →March 6, 2026
ATR and volatility filters ranked first across 615 Bitcoin strategies while oscillators like RSI finished dead last. See the full BreakoutOS filter test results.
Read more →February 27, 2026
Bar range/ATR cut max drawdown 40% and boosted profit 60% across 3,500 NASDAQ strategies. See which filters work and which fail in BreakoutOS testing.
Read more →